

Your Business Already Has Valuable Data
Every day your business generates valuable information through sales, customers, inventory, finance, marketing, and operations. The challenge isn't collecting data — it's turning that information into something useful before important decisions need to be made.
Many businesses still rely on spreadsheets, manual reports, and time-consuming analysis. By the time reports are prepared, the opportunity to act has often already passed.
Business Intelligence helps you move from searching for numbers to understanding what those numbers actually mean, allowing you to make faster and more confident decisions.
From Information to Business Insights
Raw data alone doesn't improve a business. The real value comes from understanding trends, identifying opportunities, and recognizing problems before they become expensive.
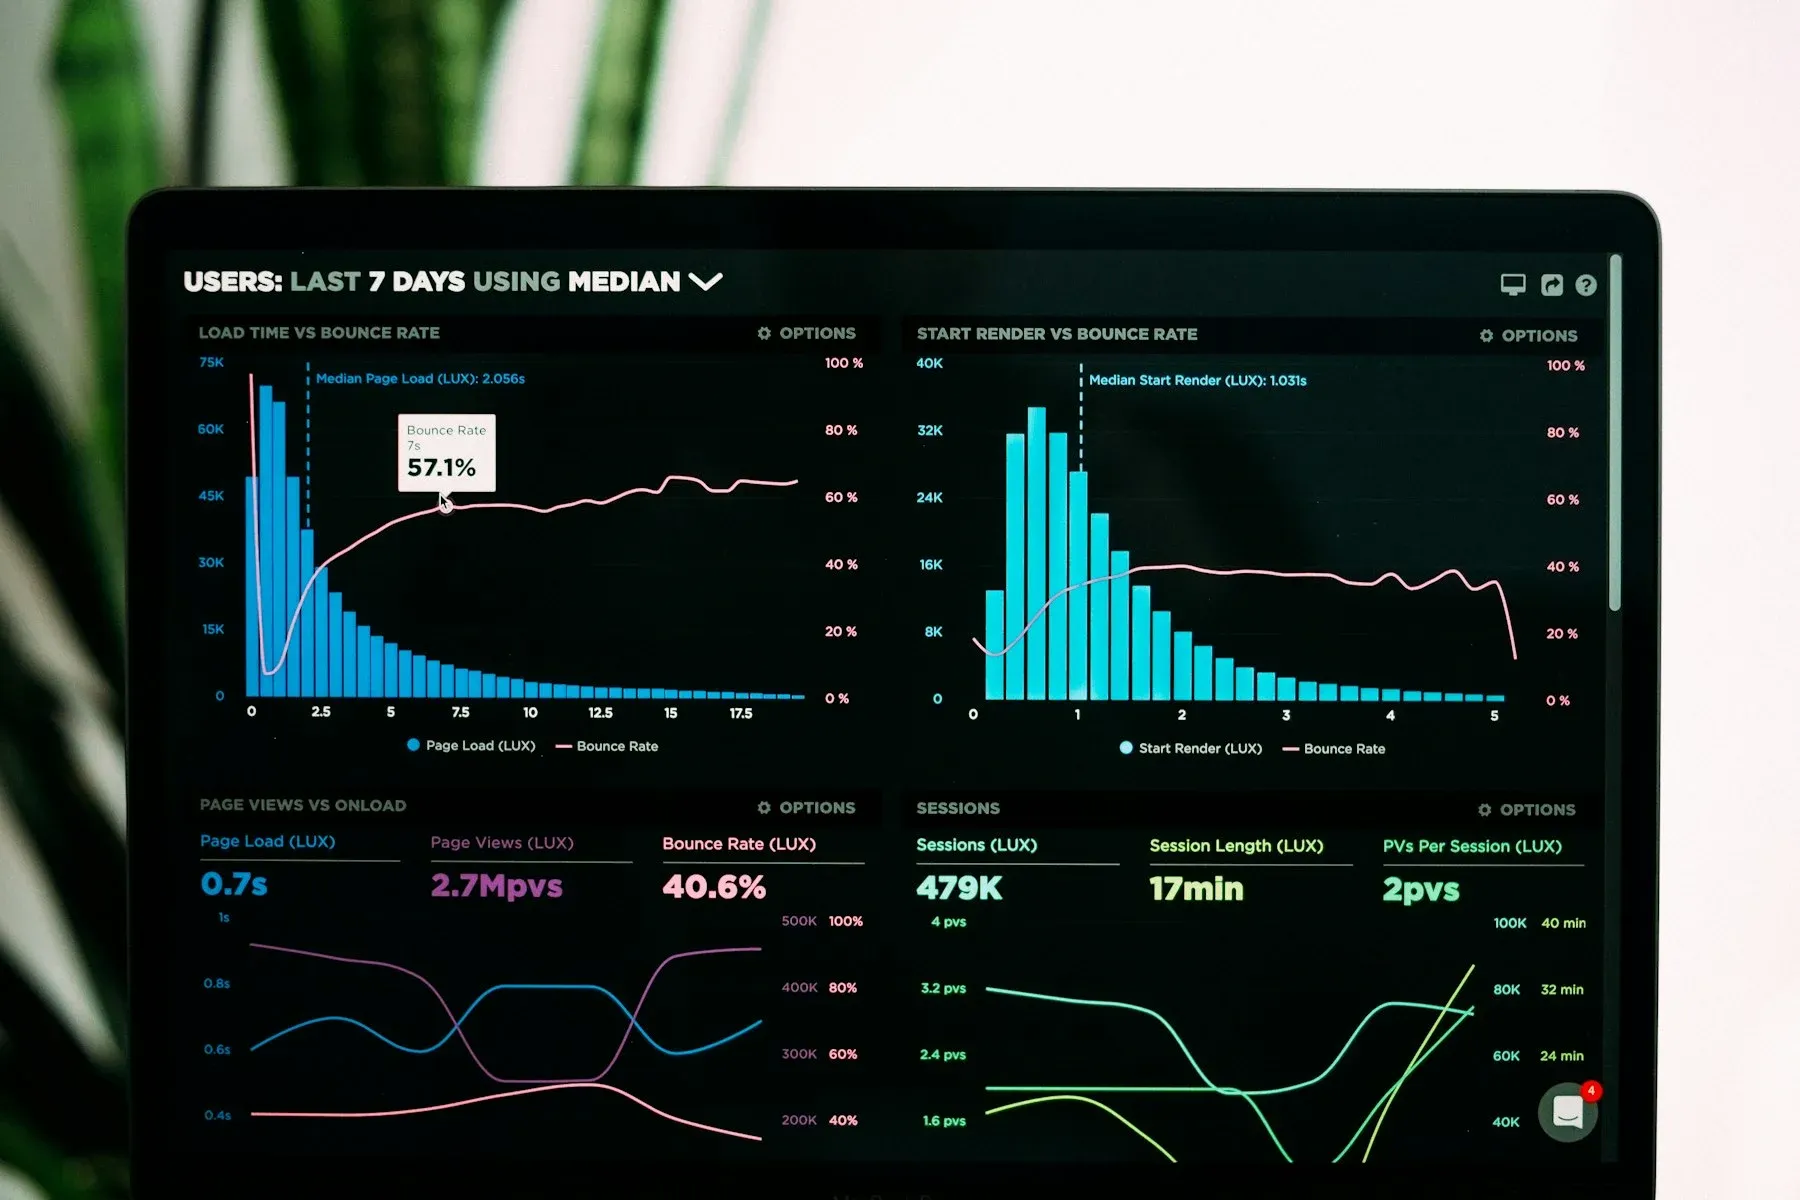
Interactive dashboards and automated reports allow business owners and managers to monitor performance in real time, compare results, and quickly identify where attention is needed.
Instead of spending hours creating reports, your team can focus on making better decisions backed by reliable information.
How Business Intelligence Helps Your Organization
Monitor Performance
Track sales, revenue, inventory, operations, and other key metrics from a single dashboard.
Make Faster Decisions
Access up-to-date business information without waiting for manual reports.
Identify Trends Early
Recognize growth opportunities, seasonal patterns, and performance changes before they impact your business.
Reduce Manual Reporting
Automate repetitive reporting tasks and eliminate hours spent preparing spreadsheets.
Improve Team Visibility
Give managers and decision-makers access to consistent, reliable business information.
Plan for Future Growth
Use historical data and forecasting to support budgeting, planning, and strategic decision-making.
When Does Your Business Need Business Intelligence?
Business Intelligence Is Usually the Right Choice When
- Important data is spread across multiple systems
- Reports are prepared manually every week
- Managers wait too long for business insights
- You want real-time visibility into performance
- Business decisions rely on spreadsheets
- You need accurate forecasting and KPI tracking
Basic Reporting May Be Enough When
- Your business has very little operational data
- You only need occasional reports
- One spreadsheet already answers your questions
- Your reporting needs rarely change
- The business is still in its very early stages
- Simple reporting already supports your decisions
Business Intelligence Solutions We Build
Every business measures success differently. That's why we build dashboards, reports, and analytics solutions around the metrics that matter most to your business — not generic templates filled with unnecessary charts.
Executive Dashboards
Business Performance Dashboards
Monitor sales, revenue, profitability, customer growth, inventory, and operational performance through a single, easy-to-understand dashboard.
KPI Dashboards
Track the key performance indicators that matter most to your business with real-time visibility and automatic updates.
Power BI Dashboards
Interactive dashboards built using Microsoft Power BI, helping businesses explore data, monitor performance, and make informed decisions.
Tableau Dashboards
Advanced data visualizations created with Tableau for businesses that require deeper analysis and interactive reporting.
Reporting & Business Analytics
Automated Business Reporting
Replace manual spreadsheets with automatically generated reports that keep decision-makers informed with the latest business data.
Sales & Revenue Analytics
Understand sales performance, customer purchasing patterns, product trends, and revenue growth opportunities.
Marketing & Customer Analytics
Measure campaign performance, customer behavior, conversion trends, and engagement to improve marketing decisions.
Financial Analytics
Gain better visibility into profitability, expenses, cash flow, budgeting, and financial performance.
Forecasting & Business Planning
Business Forecasting
Use historical business data to predict future sales, inventory requirements, demand patterns, and business growth.
Trend Analysis
Identify patterns, seasonal changes, and long-term business trends to support better strategic planning.
Decision Support Analytics
Provide leadership teams with meaningful insights that support faster and more confident business decisions.
Data Foundation
Data Cleaning & Preparation
Improve data quality by correcting inconsistencies, removing duplicates, and organizing information for accurate reporting.
Data Integration
Combine information from ERP systems, CRM platforms, websites, accounting software, spreadsheets, and other business systems into one reliable source.
Data Warehousing
Centralize business data from multiple sources to create a secure, scalable foundation for reporting, analytics, and future growth.
Questions Your Dashboard Can Answer
Which products generate the most profit?
Identify your highest-performing products and understand where revenue is coming from.
Which customers contribute the most value?
Analyze purchasing behavior, customer retention, and lifetime value.
Why are sales changing?
Monitor trends across products, regions, sales teams, or time periods to understand what's driving growth or decline.
Which inventory needs attention?
Track stock levels, slow-moving inventory, and upcoming shortages before they affect operations.
How is each department performing?
Give leadership and managers clear visibility into operational, financial, and team performance.
Where should we focus next?
Use historical trends and forecasting to prioritize opportunities and make informed business decisions.
Designed for Decisions, Not Just Data
A dashboard should help you understand your business within minutes — not require hours of training. That's why we design every dashboard with clarity, simplicity, and usability in mind.
Rather than overwhelming users with dozens of charts, we highlight the information that matters most so business owners, managers, and teams can quickly identify opportunities, monitor performance, and take action.
Whether you're reviewing today's sales or planning next quarter's strategy, the right information should always be easy to find.
Built Around Your Existing Business Systems
Your dashboards are only as useful as the data behind them. We connect Business Intelligence solutions with the systems you already use, ensuring reports stay accurate and automatically updated.
Whether your data comes from spreadsheets, ERP software, CRM platforms, accounting systems, e-commerce platforms, websites, or custom business applications, we bring everything together into one unified view.
Instead of switching between multiple systems, you'll have a single place to understand how your business is performing.
Why Businesses Partner With Rabitcube
Business-Focused Dashboards
We design dashboards around business decisions — not around software features.
Clear & Actionable Insights
Every report is built to help you understand what matters and what actions to take next.
Connected Data
We combine information from multiple systems into one reliable source of truth.
Scalable Analytics
Start with the metrics you need today and expand your reporting as your business grows.
Modern BI Technologies
We leverage trusted platforms such as Microsoft Power BI and Tableau to deliver reliable, interactive analytics solutions.
Long-Term Partnership
From dashboard development to ongoing optimization and reporting enhancements, we're here to support your business as it evolves.
Our Business Intelligence Development Process
- 01
Understand Your Business Goals
We begin by understanding your business, the decisions you need to make, and the metrics that matter most. This helps us identify the insights your dashboards should deliver.
- 02
Review & Connect Your Data
We analyze your existing data sources, clean and organize the information where necessary, and connect the systems that power your business.
- 03
Design Dashboards & Reports
We create clear, interactive dashboards and automated reports that present complex information in a simple, actionable format.
- 04
Validate & Deploy
Before deployment, we verify data accuracy, reporting logic, and dashboard usability to ensure every insight can be trusted.
- 05
Monitor & Improve
As your business evolves, we continue refining dashboards, adding new reports, and expanding analytics capabilities to support better decision-making.
Frequently Asked Questions
Do we need to replace our current software to use Business Intelligence?
No. In most cases, we can connect directly to your existing ERP, CRM, accounting software, spreadsheets, websites, or other business systems without disrupting your current operations.
Should we choose Microsoft Power BI or Tableau?
Both are excellent Business Intelligence platforms. The right choice depends on your existing technology stack, reporting requirements, team familiarity, and budget. We'll recommend the solution that best fits your business.
Can dashboard data update automatically?
Yes. Depending on your business needs, dashboards can refresh in real time or on scheduled intervals such as hourly, daily, or weekly, ensuring you always have access to current information.
Can different departments have different dashboards?
Absolutely. We can build customized dashboards for management, sales, finance, operations, marketing, HR, or any other department, giving each team access to the insights most relevant to their work.
Will our data remain secure?
Yes. We follow secure development practices, role-based access controls, and appropriate security measures to ensure only authorized users can access sensitive business information.
Who updates the dashboards when our reporting needs change?
We do. As new metrics matter, teams reorganise, or data sources change, we update existing dashboards and build new reports rather than leaving you with a static set that slowly stops matching the business.
Let's Talk
Ready to Turn Your Business Data Into Better Decisions?
Your business already generates valuable information every day. We help transform that data into meaningful dashboards, reports, and insights that support faster decisions, improve visibility, and drive long-term business growth.
- Free Business Intelligence consultation
- Dashboards tailored to your business goals
- Integration with your existing systems
- Clear implementation plan with transparent pricing
Free consultation • No commitment • Practical insights for your business